Dynamics of Negative Autoregulation
How self-repression speeds up the response time of gene circuits
In the previous article, we learned that autoregulation, and in particular negative autoregulation, is a motif in biological transcriptional networks; it occurs far more than it would at random. But what, exactly, is negative autoregulation? How does it work, and how does it provide an advantage for organisms?
Before we answer these questions, let's review some of the key concepts and equations we've learned so far. If you're already comfortable with them, feel free to skip ahead.
Click Next to go through a review of the key formulas and concepts related to transcription network dynamics. Optionally, you can select the specific review from the selection menu above, or skip this entirely if you don't require it.
Negative autoregulation occurs when a transcription factor represses its own expression; the protein that the gene expresses binds to its own promoter and inhibits the production of its own mRNA. As the protein concentration increases, it ends up reducing its own rate of production.

In Transcription Network Basics: Part Three, we explored the topic of dynamics and response time for simple regulation, and identified it as an important measure of cellular performance. Using this as a baseline, let's now look at the dynamics and response time for negative autoregulation and compare.
To keep things simple, let's begin with using a logic approximation:
so the production rate is either 0, when is less than the threshold , or at its maximum , when is greater than .
To analyze its response time, let's consider the scenario where the protein concentration is initially 0. As time progresses, the unrepressed promoter produces the protein at the full-speed rate , and so the concentration of protein changes according to the equation:
At early times, since levels are very low, the removal term is very small () and thus, negligible. This leaves us with roughly a linear accumulation formula for :
Once reaches the threshold , production immediately goes to zero (as per our step function). To make all of this a little more clear, let's look at this graphically:
Starting at , protein is produced at a rate of per unit time until it reaches the threshold (the linear line), after which production stops and stays at the same level (the horizontal line):
The green dotted line indicates the continued production of if it did not regulate itself.
From the graph, we can see that the steady state concentration of is the same as its repression coefficient, :
Response time
Remember, from Transcription Network Basics: Part Three, that response time is defined as the time it takes a protein to get to half of its steady-state level. Sticking with our simplified linear accumulation formula, that means:
and so:
From this, we can see that the stronger the maximal promoter activity , the faster the response time.
Now, how does this compare with the response time for simple regulation? Before we jump into that, we need to ensure that the comparison is fair. This is done with something known as a mathematically controlled comparisoni; essentially, both biological circuit designs should have the same target while keeping as many biochemical parameters identical as possible. In this comparison, the target is to reach the same steady-state level, a crucial quantity for optimal cellular performance.
Comparing the steady state formulas for both designs:
which, when equated, gives us:
We now have an equation that fairly compares the two designs. Let's explore this mathematically controlled comparison graphically, and see how the response time of negative autoregulation compares with simple regulation.
Let's start by plotting both the (approximate) negative autoregulation curve (in green) and the simple regulation curve (in grey).
The simple regulation curve, as seen before, is given by the equation:
where is the removal rate for the simple regulation.
For simple regulation, making the promoter stronger increases the steady-state value, possibly to a level that is too high for the cell to function properly. With negative autoregulation, on the other hand, you can pair a very strong promoter, which gives a fast initial rise and then cuts off at the steady-state level. The stronger it is, the faster the rise. Paraphrasing Uri Alon: you can drive fast if you have a powerful engine and good brakes.
Real world examples
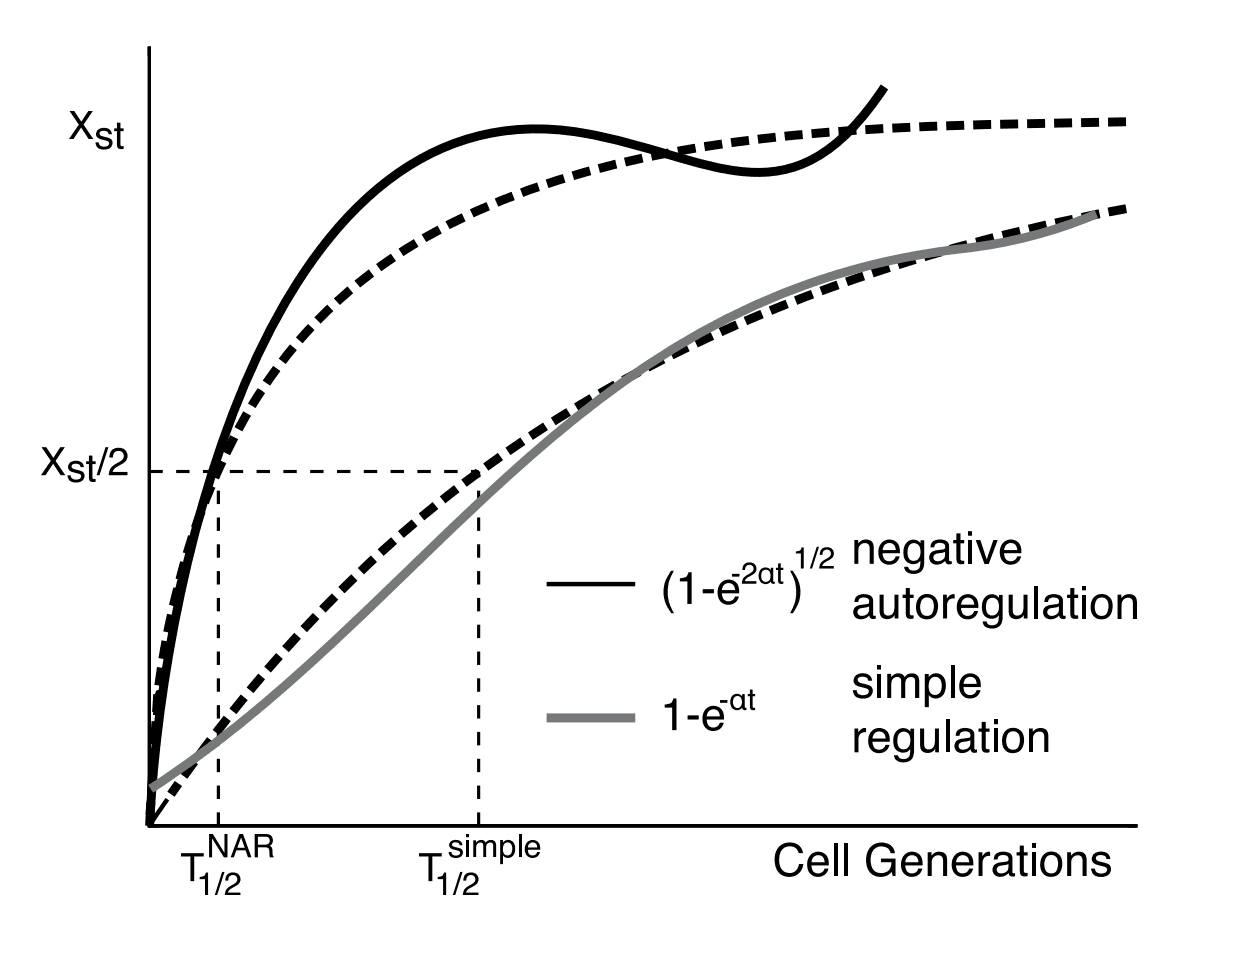
Negative autoregulation's speed-up has been proven experimentally in a paper by Nitzan Rosenfeld, Michael B. Elowitz, and Uri Alon. The image below shows an adaption of their experimental chart:

The response time of negative autoregulation in their synthetic gene circuit is about 5x as fast as simple regulation version.
An example that's more relatable easily is our immune cells. When bacteria or viruses invade our body, immune cells need to multiply rapidly to fight the infection. Too many immune cells, however, can cause inflammation and damage healthy tissue. Negative autoregulation helps maintain this delicate balance, allowing for a quick response to a threat but also preventing the immune system from overreacting. The system also enables reaching normal cell levels once the threat is neutralized.

Speeding up responses is one of the key advantages of negative autoregulation. In the next article, and the final part on autoregulation, we'll explore another advantage: robustness.
If you liked this and would like to hear when new content is published, please subscribe below.
If you have any feedback, found bugs, or just want to reach out, feel free to DM me on Twitter or send me an email.
Subscribe to Newt Interactive
You'll only get emails when I publish new content. No spam, unsubscribe any time.